
Riding out extreme heat
A case study of New York City’s 2019 heat waves indicates that in extremely hot weather, people may be more likely to turn to ride-hailing services like Uber or Lyft for their transportation needs, especially those living in higher-income neighborhoods.
In cities across the US, heat waves are becoming longer, more frequent, and more intense over time. Heat-related deaths are by far the most common weather-related fatality in the country, making extreme heat the most dangerous of the extreme weather events on the rise due to climate change.
Transportation methods vary greatly in how long they leave travelers exposed to the outdoors. Pedestrians and bikers bear the brunt of precipitation, extreme temperatures, and humidity; bus riders face these factors, too, while waiting at bus stops. Drivers or subway riders, on the other hand, are more insulated from weather conditions.
Yet little research has been done to understand how extreme weather, like intense heat, changes how people choose to travel, noticed Carnegie Mellon engineering faculty Jeremy Michalek, Destenie Nock, and Corey Harper. Having such information would empower transportation planning and policymaking that is more responsive to the predicted effects of climate change.
Source: Transportation Research Part D: Transport and Environment
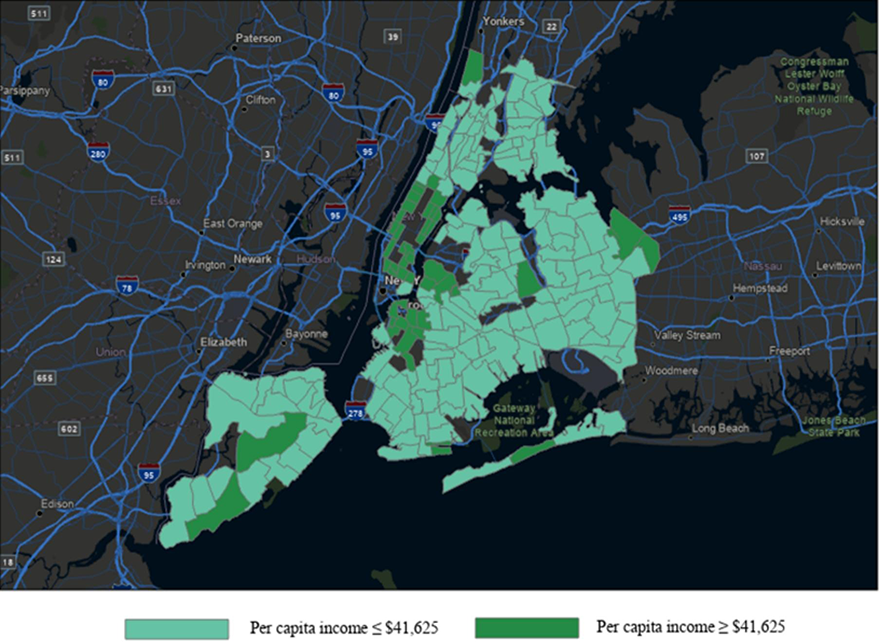
The researchers divided New York City into zones with higher (dark green) or lower (light green) per capita income.
Hoping to develop statistical models for the impact of extreme heat on travel behavior, the research team investigated changes in the use of private driving services like those offered by transportation network companies (TNC), selecting the July 2019 heat waves in New York City as a case study.
“Transportation network companies, such as Uber and Lyft, play a key role in modern urban transportation. These services are used by many individuals, including those in low-income communities,” says Harper, assistant professor of civil and environmental engineering. “One research question we had is: Do people use these services more during inclement weather events, and does this vary with income?”
Using weather advisories as behavioral thresholds allows us to pinpoint when heat becomes not just uncomfortable, but behavior-changing—and design policy to match.
Destenie Nock, Assistant Professor, Civil and Environmental Engineering, Engineering and Public Policy
Their work, funded by the Scott Institute for Energy Innovation and the US Department of Transportation and recently published in Transportation Research Part D: Transport and Environment, revealed that TNC usage rose city-wide during extreme heat, but that afternoon peak trips to higher-income neighborhoods increased more than trips to lower-income neighborhoods.
The researchers used publicly available data including TNC trip records, demographic information, and transit accessibility information to find out how many rides had been taken to and from different neighborhoods on any given day. When they compared days where heat advisories or heat warnings had been issued by the National Weather Services against matching days of the week with no such messages, they found that ridership as a whole increased by 6 to 9% on heat event days.
However, the increase in rides was greater in New York City’s high-income neighborhoods, which also have higher baseline ridership. The researchers found that for every $10,000 increase in a neighborhood’s per capita income, TNC usage increased by about 0.5 rides per 1,000 people.
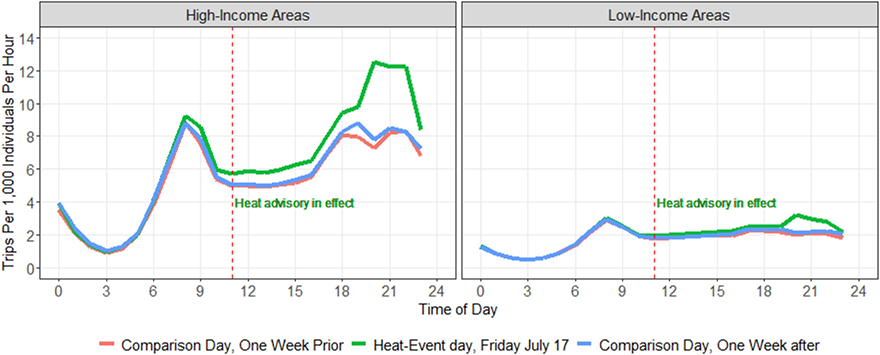
Source: Transportation Research Part D: Transport and Environment
After a heat advisory was issued on July 17, TNC usage rose compared to control days, and the increase was greater in high-income neighborhoods than low-income neighborhoods.
“Uber and Lyft offer additional travel options that can be helpful during extreme weather, and our study finds that NYC travelers increase their use during heat waves. In particular, evening travelers to high-income zones use Uber and Lyft more heavily than travelers to low-income zones, suggesting that higher-income travelers make the greatest use of this extreme weather option,” says Michalek, professor of engineering and public policy and mechanical engineering.
Though the study did not directly determine whether people in low-income neighborhoods were at a greater risk for heat exposure due to their proportionally lower usage of TNCs, it is known that low-income urban neighborhoods are already hotter on average due to limited vegetation producing heat island effects. As a result, it will be important to consider strategies to make sure individuals from all socioeconomic groups have access to transportation methods that allow them to stay safe from extreme heat.
“Understanding travel behavior patterns will provide insight on that process,” says Nock, assistant professor of engineering and public policy and civil and environmental engineering. “Using weather advisories as behavioral thresholds gives us a new tool: we can now pinpoint when heat becomes not just uncomfortable, but behavior-changing—and design policy to match.”
Similarly, there are steps that could be taken to promote TNC usage in lower-income neighborhoods during extreme heat. “Tax exemptions and subsidies could be implemented during heat waves, in areas where there are a lot of low-income individuals who do not have access to transit systems. In addition to this, incentives could also be given to drivers to help them relocate throughout the city, helping to lower wait times and improve access to these services during inclement weather events,” says Harper.
Corresponding author Mahtot Gebresselassie worked on this study while serving as a civil and environmental engineering postdoctoral fellow at Carnegie Mellon University.
This research received support through the Wilton E. Scott Institute for Energy Innovation and Mobility21 National University Transportation Center at Carnegie Mellon University.