
Greenhouse gas emissions from Pittsburgh’s food system
A new report from a student team details the climate impacts from the production, packaging, transportation, and refrigeration of all food consumed in Allegheny County.
A first-of-its-kind study by a team of 19 Carnegie Mellon University students has estimated the carbon footprint of the entire food system of Allegheny County. Their study tabulates the emissions of planet-warming greenhouse gases (GHGs)—mainly carbon dioxide, methane, and nitrous oxide—associated with the sum of activities required to get food from farm to table. Their calculations include the emissions from the production, packaging, and transportation of food brought into the region, as well as from local distribution and refrigeration, and even landfilling of food waste by residents around Pittsburgh.
Allegheny County’s food system produces 3.7 million tons of carbon dioxide equivalent (CO2e) emissions per year, with each person responsible on average for 3.1 tons CO2e per year. This per-person estimate is equivalent to the emissions of driving roughly 7,600 miles in a typical passenger vehicle. For Allegheny County as a whole, the emissions from the food system are more than the yearly emissions from the generation of electricity required to power all households in the county.
“We are not aware of any other major cities or urban areas who have undertaken a study like this,” said Ed Rubin, a professor of engineering and public policy (EPP) and mechanical engineering and one of the faculty advisors for the project. “We found there were no easy answers to basic questions like: how much food of what types is consumed in our region, and what is its carbon footprint?”
Rubin developed the idea of the study for the EPP Project Course, a senior-level capstone course designed to bring multi-disciplinary student teams together to work on unstructured, real-world problems. The course is celebrating its 50th anniversary this year. Over the years, student teams have tackled a wide variety of technology-policy issues, both global and local in focus.
“I was aware that the City of Pittsburgh was revising its Climate Action Plan,” said Rubin, which was updated in 2018 and includes a major section on the role of the urban food system, a topic of growing international interest. However, the Climate Action Plan’s GHG inventory focuses on specific sources of city-wide emissions like on-road vehicles and nearby power plants. It does not include the overall impact of activities like the demand for food consumed in the Pittsburgh region, which mostly generates emissions elsewhere. “So to provide that bigger picture, and understand what we could do locally, the City was a major audience for this project.” Because so many people live outside the city limits, the study region was expanded to Allegheny County.
Compiling these emissions estimates for the county’s food system was a massive undertaking. The study team consisted of 19 students, two project managers, two faculty advisors, and an expert review panel that included city government officials, leaders from local non-profits, and supply-chain experts from food suppliers and distributors.
Before the team could quantify the food system’s GHG emissions, they first estimated the amounts of different foods consumed in Allegheny County, most of which are imported from outside the region. Then they tracked that food through the local economy. “Without first knowing how much food is being consumed you can’t know what its associated climate impact might be,” said Rubin.
The biggest sources of GHG emissions are two things Pittsburghers are known to love—beef and beer. By weight, beer was the most consumed food product in the county, representing 29% of all the food consumed. Beef, on the other hand, represented less than 3% of the total mass of all food, but contributed 34% of all GHG emissions, by far the biggest source. Beer was a distant second, at 10%.
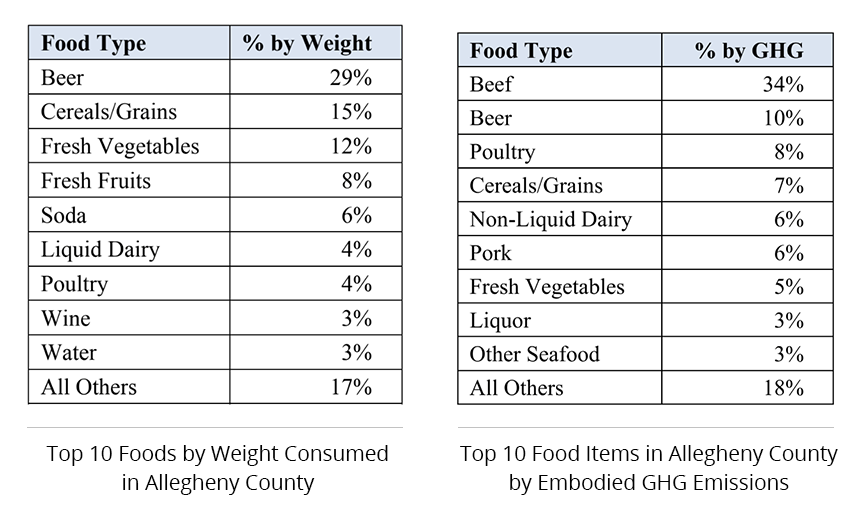
“Beer is really heavy and we drink a lot of it,” said Shuchen Cong, an EPP master’s student who supervised the team as one of two project managers. Much of the GHG emissions embodied in beer are from the energy needed to transport it. By contrast, emissions associated with beef owe to significant inputs of animal feed, which is land-, energy-, and water-intensive. Additionally, cows digest food in a way that produces significant quantities of methane. “We could really lower our carbon footprint by eating less beef and drinking less beer,” said Cong.
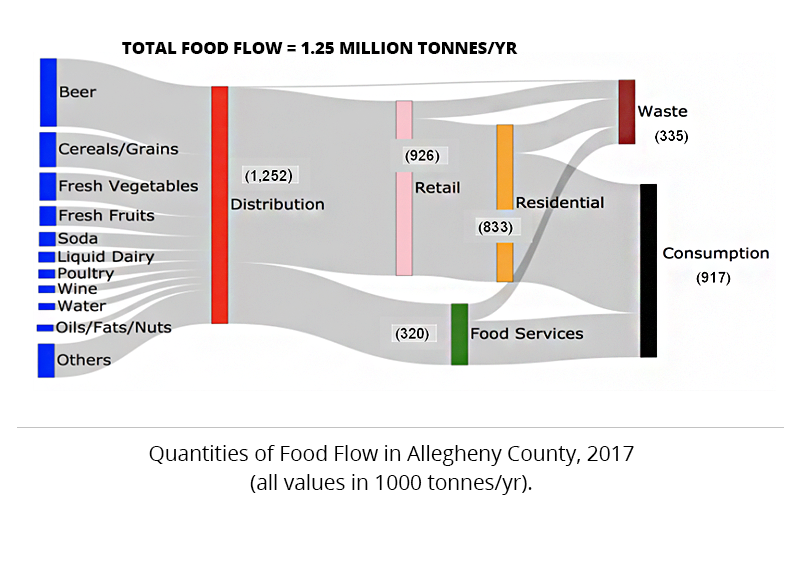
Tracking the flows of different foods through the county revealed how emissions are distributed across the retail, residential, and food service sectors of Pittsburgh’s food economy. On average, Pittsburghers consume 73% of their food at home, and the other 27% at food service venues, such as restaurants, movie theatres, and school cafeterias.
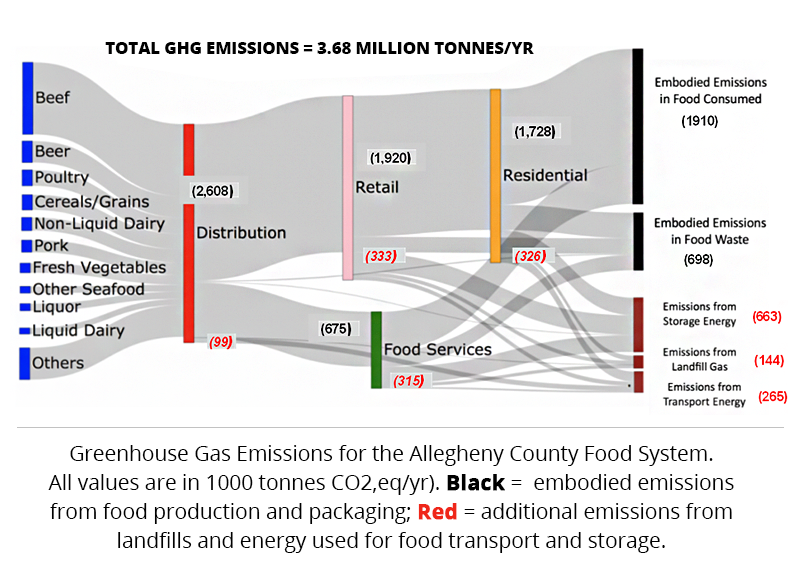
The study also found that a significant amount of food is wasted in Allegheny County: 370,000 tons of food, or 27% of all food purchases, find their way to trash cans each year. While a significant amount of GHG emissions are “embodied” in this wasted food (698,000 tons CO2e), the emissions from food waste do not stop there. Additional emissions are produced by trucks hauling food waste to landfills where it ultimately decomposes, producing additional GHG emissions. While Pittsburgh-area landfills capture and use some of these emissions for energy, many still escape to the atmosphere. The figures below show the total quantities of food at each stage of the Pittsburgh food system, as well as their associated GHG emissions.
The team’s analysis will be of interest to local stakeholders in Pittsburgh, especially given the stated climate goals of the City of Pittsburgh. Beyond Pittsburgh, the study presents a model for how researchers in other locations can quantify emissions from their own food systems, a task of growing importance as urban areas continue to grow in population and more governments make commitments to reduce their GHG emissions.
“By 2050, almost 70% of the global population will live in cities, and right now our food systems are responsible for about a quarter of all global carbon emissions,” said Cong.
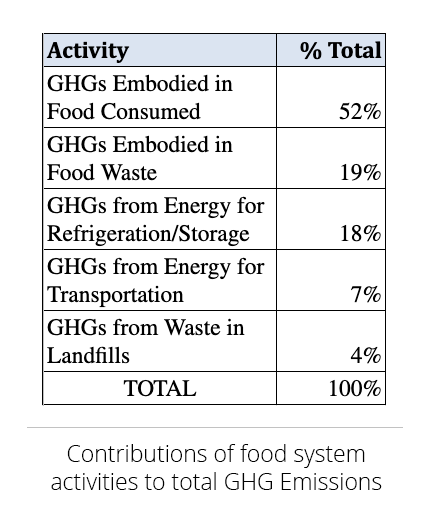
The report concludes with a number of recommendations for the most effective ways to reduce emissions. These include policies to help encourage shifting consumer diets away from meat, reducing food wastes, and incentivizing the replacement of old refrigeration units by newer, more efficient ones. 18% of all emissions from the Allegheny County food system come from the electricity required for refrigeration.


Both Rubin and Cong emphasized that making informed policy recommendations necessarily requires an analysis that looks at the emissions across each part of the food system. Rubin also emphasized the need for more complete and systematic data on the types and quantities of food consumed at the urban level. “Without better data,” said Rubin, “you can’t begin to rigorously address the key question, which is: What measures are available and most effective to reduce our carbon footprint?”